Pro Forma vs. Actual Cash Flow: How to Spot Gaps in Rental Projections
A pro forma shows what a rental property could earn under ideal conditions, while actual cash flow reflects real operating income. Here is how to spot the gap.
Pro Forma vs. Actual Cash Flow: How to Spot Gaps in Rental Projections
Where Pro Forma Numbers Diverge from Operating Reality
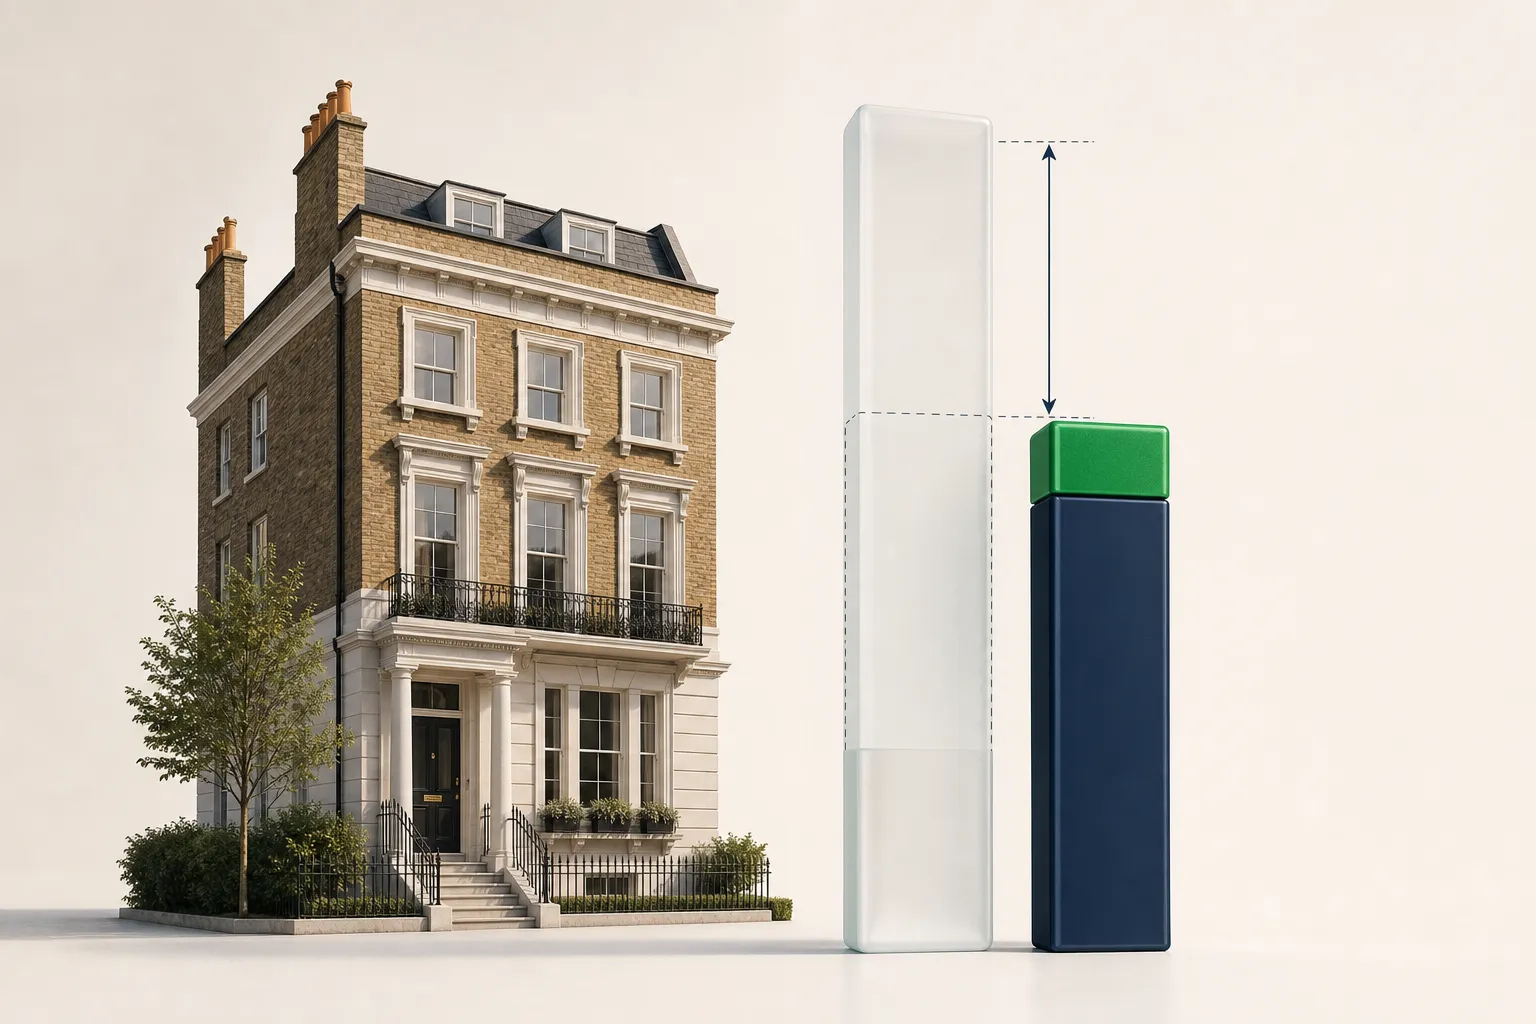
A pro forma is a hypothetical projection of a rental property's financial performance under ideal conditions, whereas actual cash flow reflects the exact net dollars remaining after real-world income, operating expenses, and debt service clear your bank account. Real estate listings and broker marketing packages routinely rely on pro forma projections that paint a best-case scenario, often overestimating net operating income by 15% to 40%.
Paper projections typically fail because they treat an unpredictable physical asset like a guaranteed dividend. When buying or evaluating a rental property, trusting an unadjusted seller pro forma leaves you vulnerable to unexpected negative cash flow. To protect your capital, you need to understand where paper projections systematically strip out realistic operating friction and how to rebuild those figures using historical operational baselines.
Side-by-Side Comparison: Paper Pitch vs. Year One Reality
To see how quickly a profitable projection can deteriorate, consider an example of a single-family rental purchased for $250,000 with a 20% down payment ($50,000) and a monthly mortgage payment of $1,250 (principal and interest totaling $15,000 annually).
In the broker's marketing pro forma, the property is advertised as a turnkey earner producing strong double-digit cash-on-cash returns. Here is how that pro forma compares to what a landlord actually experiences across the first 12 months of ownership:
| Line Item | Broker Pro Forma | Actual Year 1 Performance | Variance | Notes on Reality |
|---|---|---|---|---|
| Gross Scheduled Rent | $26,400 ($2,200/mo) | $26,400 ($2,200/mo) | $0 | Market rent target was achieved |
| Vacancy Loss | -$792 (3%) | -$2,200 (1 month / 8.3%) | -$1,408 | 30-day turn between tenants |
| Effective Gross Income | $25,608 | $24,200 | -$1,408 | Total collected revenue |
| Property Taxes | -$2,800 | -$3,700 | -$900 | Taxes reassessed at new purchase price |
| Landlord Insurance | -$1,100 | -$1,550 | -$450 | Broker used outdated baseline policy |
| Property Management | $0 (Self-managed) | -$2,420 (10% of rent) | -$2,420 | Owner hired manager after relocation |
| Routine Maintenance | -$1,056 (4%) | -$2,100 | -$1,044 | Plumbing leaks, lock changes, drywall patch |
| CapEx Reserves | $0 | -$1,800 | -$1,800 | Setting aside funds for aging water heater & roof |
| Total Operating Expenses | -$4,956 | -$11,570 | -$6,614 | Actual expenses more than doubled |
| Net Operating Income (NOI) | $20,652 | $12,630 | -$8,022 | Core operational profitability |
| Annual Debt Service | -$15,000 | -$15,000 | $0 | Fixed-rate mortgage principal and interest |
| Net Annual Cash Flow | +$5,652 | -$2,370 | -$8,022 | Property operated at a monthly deficit |
In this example, the pro forma promised $471 per month in net cash flow ($5,652 annually), representing an apparent 11.3% cash-on-cash return on the $50,000 down payment. In practice, the property lost $197.50 per month (-$2,370 annually) because the pro forma omitted management fees, underestimated tax assessments, ignored capital reserves, and used an aggressive vacancy rate.
The Four Systemic Blind Spots in Seller Pro Formas
Brokers and sellers do not necessarily invent fake numbers to mislead buyers; rather, standard pro forma templates are designed to market an asset's maximum theoretical capacity. As a buyer or portfolio manager, you must audit four specific operational blind spots where pro formas consistently break down.
1. Property Tax Reassessment Lag
Sellers list property taxes based on their existing tax bill. However, municipalities frequently reassess property values upon a sale transfer. If the seller bought the property ten years ago for $140,000 and you purchase it for $250,000, your new property tax bill will eventually reflect the higher assessed valuation. Basing your long-term cash flow model on the previous owner's historical tax liability creates an immediate structural deficit.
2. The Complete Erasure of CapEx
A standard listing pro forma rarely accounts for capital expenditures (CapEx). While routine operating expenses cover unclogging a drain or servicing a furnace, CapEx covers long-term structural replacements—such as roofs, HVAC units, asphalt paving, and sewer lines. Distinguishing between short-term repairs and major replacements is critical; read our breakdown on CapEx vs OpEx for rental properties to understand how to budget for long-life structural components.
3. Underestimating Total Turnover Costs
Pro forma models typically represent vacancy as a single percentage deduction from gross revenue (often 3% to 5%). While a 5% vacancy rate mathematically equals roughly 18 days of empty time per year, physical vacancy is only half the cost of tenant changeover. Real-world tenant turns require professional cleaning, paint touch-ups, lock changes, leasing administrative fees, and utility carrying costs while work is performed. To see how these friction costs accumulate, review our guide on calculating true tenant turnover costs.
4. Phantom "Free" Self-Management
Listing sheets frequently display a $0 management expense under the premise that the incoming owner will self-manage the asset. This distorts the asset's true investment value. Even if you plan to manage the property yourself, your financial underwriting must include a standard market rate for professional property management (typically 8% to 10% of gross rents plus placement fees). If the deal only breaks even when you donate your personal time to manage it, the property is subsidizing poor cash flow with uncompensated labor.
How to Rebuild and Stress-Test a Pro Forma
When evaluating an investment listing or reviewing your own portfolio forecasts, do not accept pro forma summaries at face value. Follow this systematic process to convert marketing projections into realistic cash-flow expectations:
`` Step 1: Determine realistic market rent (subtracting any tenant concessions) Step 2: Apply a conservative economic vacancy factor (minimum 8.33% / 1 month) Step 3: Calculate full operating expenses using regional baselines Step 4: Deduct annual debt service (P&I) Step 5: Compare the resulting Net Operating Income against historical benchmark ratios ``
Benchmark Operating Expense Ratios
To quickly check whether a seller pro forma is mathematically plausible, compute its Operating Expense Ratio (OER):
Operating Expense Ratio = Total Operating Expenses / Effective Gross Income x 100
For most single-family and small multifamily properties where the tenant pays primary utilities, operating expenses (excluding mortgage debt) generally consume 35% to 50% of collected revenue. If a listing pro forma shows an OER of 20% or 25%, the seller has almost certainly excluded property management, deferred maintenance, or realistic capital reserves. For a deep dive into benchmarking these operational costs, read our guide on the operating expense ratio for rental properties.
Use a Net Cash Flow Calculator
Before making an offer or adjusting your holding strategy, run the numbers through an independent tool. You can use our rental cash flow calculator, which works out true monthly and annual net cash flow by factoring in realistic vacancy allowances, ongoing operating costs, debt service, and dedicated reserve allocations.
Monitoring Projections vs. Actuals in an Active Portfolio
The gap between projections and reality does not vanish once you acquire a property. Experienced landlords continuously track monthly variance across their operating assets to catch budget drift early.
To conduct a meaningful monthly variance review:
- Log Recurring vs. One-Off Expenses Separately: Group predictable costs (insurance, mortgages, property taxes) separately from variable repairs so you can see whether budget overruns stem from systemic price increases or isolated repair events.
- Track Gross Effective Rent Against Lease Agreements: Ensure that what is recorded on the lease agreement matches the exact funds clearing your operating accounts, accounting for partial payments, late fees, or utility chargebacks.
- Monitor Rolling 12-Month Averages: Because rental property expenses are seasonal—with maintenance and utilities often spiking in summer or winter—evaluating cash flow on a rolling 12-month basis prevents premature panic during expensive months and prevents overspending during high-cash-flow quarters.
By treating listing pro formas as rough starting hypotheses rather than financial guarantees, you can filter out underperforming deals before committing capital and manage your active rentals based on real operating profit.
Propertira helps you track monthly rental income and actual expenses across your entire portfolio, giving you a clear view of true cash flow per property without complicated setups.
- cash flow
- pro forma
- underwriting
- financial analysis
- rental expenses
Related guides
- What Is a Good Cash Flow Per Door? How to Benchmark Your RentalsA realistic cash flow per door benchmark ranges from $150 to $350 per month, but only if you factor in vacancy and capital reserves. Here is how to evaluate your portfolio accurately.
- Principal vs Interest: Why Your Mortgage Payment Hides Your Real ReturnA single mortgage payment lumps two entirely different financial events together: an operating borrowing cost and forced equity savings. Here is how to separate them to measure your true rental returns.
- Rental Property Cash Flow vs. Taxable Income: Why They Rarely MatchYour rental property's bank balance and its net taxable profit almost never align at tax time. Here is how mortgage principal, depreciation, and CapEx create the gap.
Put this into practice
Use the free calculators with your own figures, or track every property in one place with Propertira.
Propertira provides estimates based on the information you enter. Results are for informational purposes only and are not financial, tax, legal or investment advice.