7 Signs Your Rental Property Is Underperforming
A rental property rarely fails all at once. Here are 7 signs your rental property performance is slipping — and how to catch it before the numbers do.
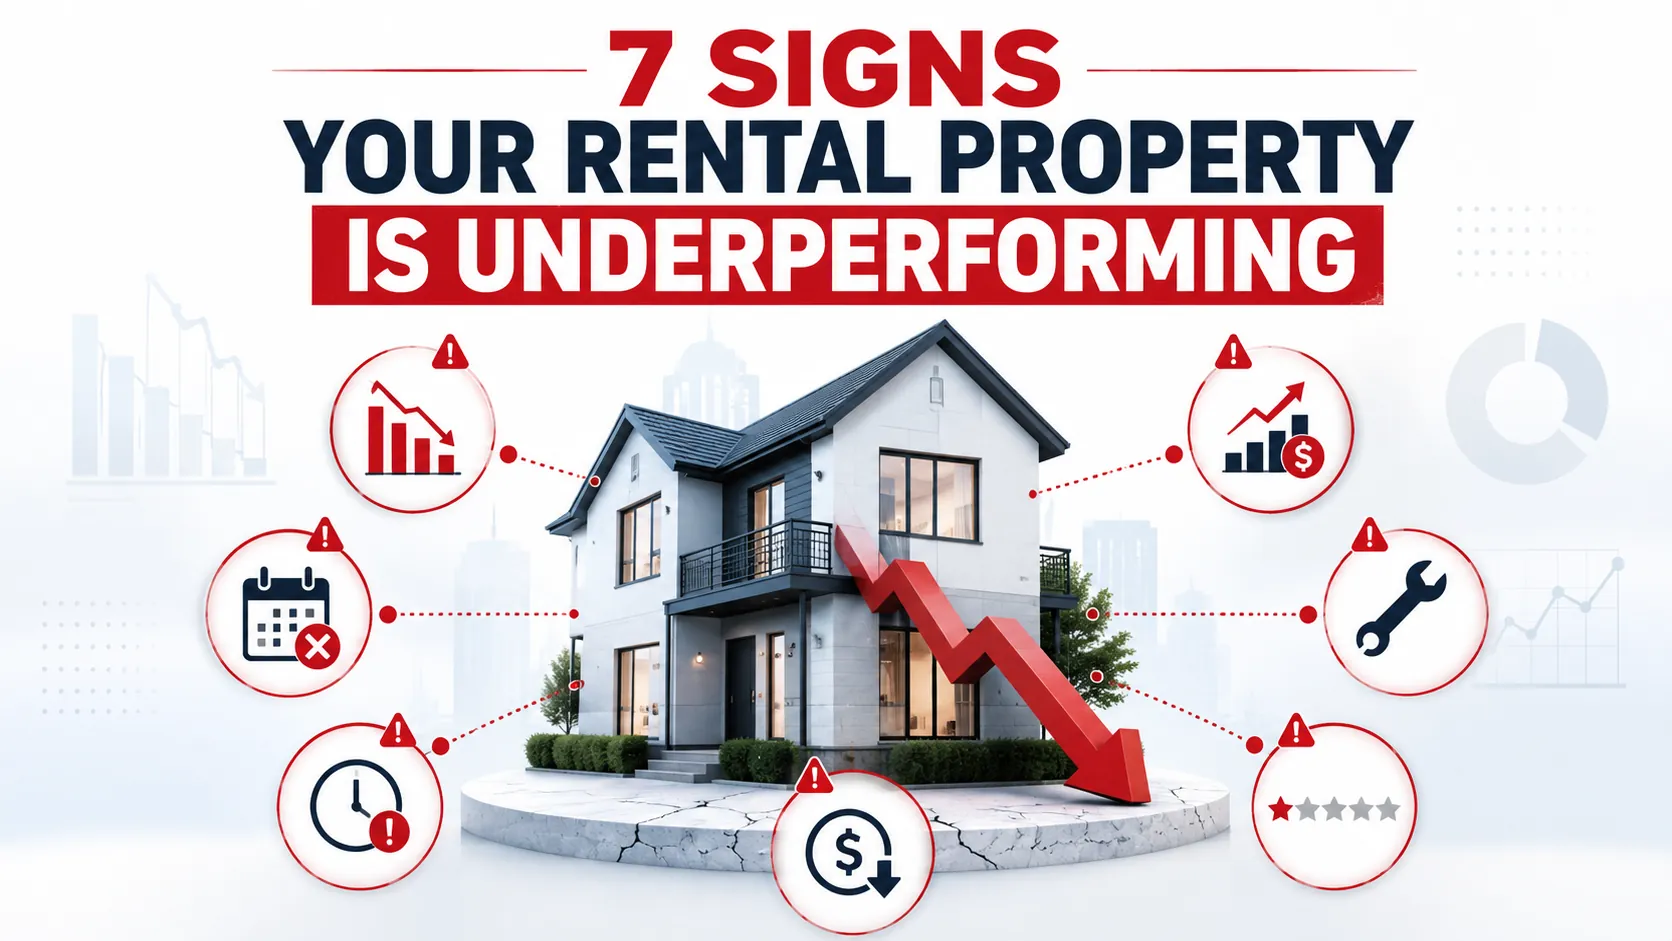
A rental property rarely fails all at once. It's usually a slow drift — a little less cash flow each month, a vacancy that runs a bit longer than the last one. None of it looks like a crisis in the moment. Add it up over a year and it often is one.
Here are seven signs worth checking for, and what each one is usually telling you.
1. Cash flow keeps shrinking
$620 → $540 → $420 → $310
If you laid your last four months of cash flow side by side and they looked something like that, something is changing — even if every individual month still looks "fine" on its own. A single bad month is normal. A consistent downward trend, month over month, is the clearest early signal that a property's performance is slipping, and it's usually visible well before anything actually goes wrong.
The catch is that this only shows up if you're looking at cash flow as a trend, not a snapshot. One month in isolation rarely tells you anything.
2. Expenses are rising faster than rent
Rent tends to move slowly — once a year, if at all, depending on your lease terms and local market. Expenses don't follow the same schedule. Insurance premiums, service charges, management fees, and maintenance costs can all creep up independently, and if they're rising faster than your rent, your margin is quietly shrinking even while your top-line income looks stable.
This is easy to miss because rent is the number landlords tend to watch. Expenses are the number that actually needs watching for this signal.
3. Vacancy is eating more income than it used to
A vacant month costs more than just the missing rent — the mortgage, insurance, and other fixed costs keep running while nothing comes in. If a property's vacant periods have been getting longer, or happening more often, that cost compounds in a way that's easy to underestimate if you're not tracking it directly.
4. Repairs are becoming more frequent
Every property needs occasional maintenance — that's normal and expected. What's worth paying attention to is frequency increasing over time on the same property. A property that needed two repair callouts last year and six this year isn't just having a bad run; it's often a sign of an aging system, deferred maintenance catching up, or a property that's simply becoming more expensive to keep in good condition.
This one is easy to shrug off repair by repair, since each individual fix seems small. It's the pattern across a year that tells the real story.
5. One property performs far worse than the rest of your portfolio
If you own multiple properties, this is one of the fastest diagnostics available: line them up side by side. A property that consistently sits at the bottom — lower cash flow, higher vacancy, more frequent repairs — relative to your other properties is telling you something specific, even if its numbers alone don't look alarming in isolation.
The catch, again, is that this only works if you're actually comparing properties side by side on a regular basis, rather than reviewing each one separately.
6. You're judging performance by gross rent, not actual cash flow
Gross rent is the number that shows up on a lease. Cash flow is the number that shows up in your pocket after mortgage, insurance, management, and running costs. A property with strong rent can still be a weak performer once its full cost structure is accounted for — and a property with more modest rent can outperform it once the actual numbers are compared.
If "how's this property doing" is answered by looking at the rent roll rather than the cash flow after costs, it's worth checking whether that answer would change if you looked at the real number.
7. You genuinely can't tell if performance is improving or getting worse
This is the sign underneath all the others. If someone asked you right now whether each of your properties is trending better or worse than six months ago, could you answer confidently? A lot of landlords can describe their properties' current state reasonably well, but far fewer can describe the trend — because that requires consistent monthly records, not just a current snapshot.
Not being able to answer that question isn't a failure of judgment. It's usually just a tracking problem: without monthly history recorded consistently, there's no trend to look at, only a series of disconnected snapshots.
Turning signs into an answer
Individually, none of these seven signs is necessarily a red flag. A single soft month, one unusually large repair bill, a slightly longer vacancy — all of that happens in normal, healthy property ownership. What matters is whether you can actually see the pattern when several of them show up together, and on which property.
That's the real obstacle for most landlords: you can't spot an underperforming property if you're not comparing its performance over time, and against your other properties, on a consistent basis. Common measures like cash flow, vacancy rate, and cash-on-cash return are only useful if they're tracked consistently enough to reveal a trend — a single month of any of them tells you comparatively little.
This is exactly what a monthly, per-property dashboard is built to surface. Propertira keeps cash flow, running costs, and vacancy tracked automatically for every property, side by side, month over month — so a property that's quietly drifting shows up as a trend on a dashboard, not as a surprise a year later.
[See your properties side by side with Propertira →](https://propertira.com)
FAQ
What's the biggest sign of an underperforming rental property? A consistent downward trend in cash flow over several months is usually the clearest signal — more reliable than any single month, which can dip for normal reasons.
What rental property metrics should I track to spot underperformance? Monthly cash flow, vacancy days, and repair frequency are the most useful to track consistently. Cash-on-cash return is also commonly used, though it's typically reviewed less frequently than monthly cash flow.
How do I know if one property is underperforming compared to my others? Compare cash flow, vacancy, and running costs across all your properties side by side on a regular basis. A property that consistently sits at the bottom of that comparison is worth a closer look, even if its numbers seem acceptable in isolation.
Is gross rent a good measure of rental property performance? Not on its own. Gross rent shows income before costs; actual performance is better measured by cash flow after mortgage, insurance, management, and running costs are accounted for.
Work it out on your own numbers
Rental property profit calculator runs this maths for you - enter your rent and costs and see the result straight away. No sign-up needed.\n
- rental property cash flow
- rental property metrics
- rental property performance
- rental property profitability
- underperforming rental property
Related guides
- Rental Property Payback Period: How to Calculate It (with Examples)The rental property payback period measures how many years it takes for cumulative net cash flow to recover your upfront cash investment. Here is how to calculate it accurately.
- Break-Even Occupancy Rate: How to Calculate It for Rental PropertiesCalculate the exact percentage of the year your rental property must stay occupied to cover all operating expenses and mortgage payments without losing cash.
- Keep or Sell? How to Run the Numbers on an Underperforming RentalDeciding whether to keep or sell an underperforming rental comes down to Return on Equity and opportunity cost. Here is how to run the numbers step by step.
Put this into practice
Use the free calculators with your own figures, or track every property in one place with Propertira.
Propertira provides estimates based on the information you enter. Results are for informational purposes only and are not financial, tax, legal or investment advice.