Rental Property Payback Period: How to Calculate It (with Examples)
The rental property payback period measures how many years it takes for cumulative net cash flow to recover your upfront cash investment. Here is how to calculate it accurately.
Rental Property Payback Period: How to Calculate It (with Examples)
Calculating the Exact Horizon to Recover Your Capital
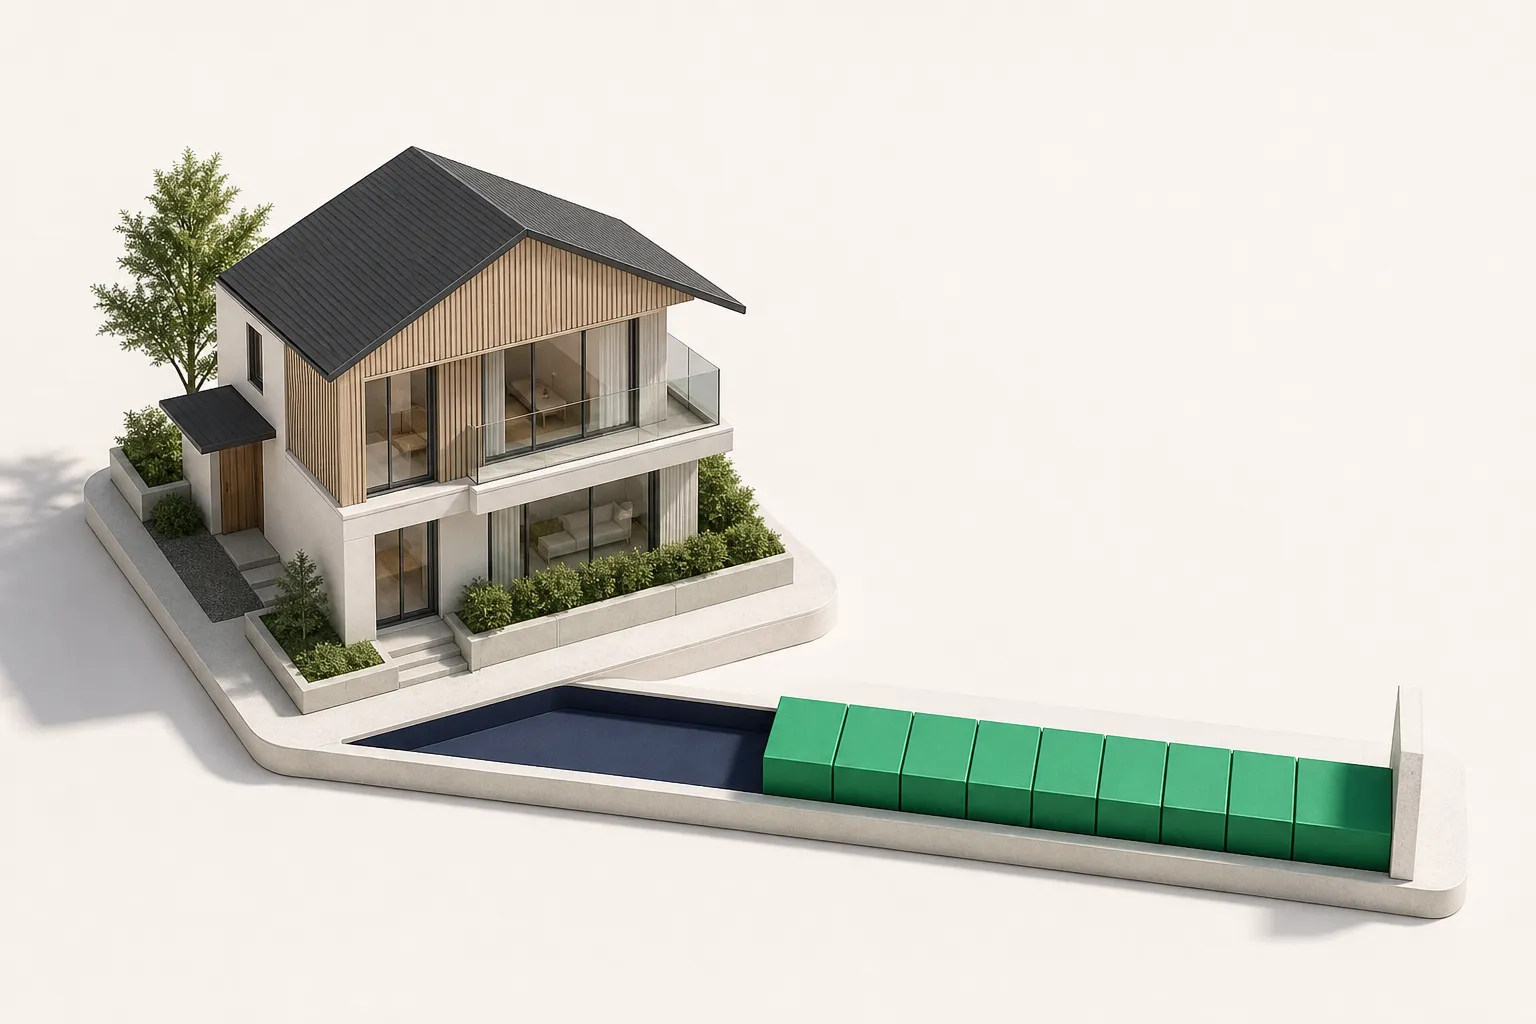
The rental property payback period is the exact number of years it takes for your cumulative net cash flow to equal your total upfront cash investment. Once your rental reaches this breakeven threshold, your initial invested capital has returned to your pocket, and every subsequent dollar of cash flow represents true profit generated on "house money."
For small landlords, the payback period serves as a practical measure of liquidity and capital risk. While long-term metrics like total return or appreciation account for wealth built on paper, the payback period answers a much more pressing operational question: How long is my cash exposed before this property pays for its own acquisition?
Understanding this timeline prevents you from overestimating your liquidity and helps you compare the capital recovery speed of different properties.
The Standard Rental Property Payback Period Formula
Calculating the baseline payback period requires two core numbers: the total upfront capital you deployed to acquire and stabilize the property, and the net annual cash flow generated after all operating expenses and debt service are paid.
At its simplest, assuming cash flow remains steady every year, the basic formula is:
Payback period (in years) = total upfront cash invested / annual net cash flow
`` Payback Period (Years) = Total Cash Invested / Annual Net Cash Flow ``
1. Total Upfront Cash Invested
Do not make the mistake of using only the purchase price or down payment. Your total cash invested includes every out-of-pocket dollar required to get the property operational:
- Down payment
- Loan origination and closing costs (escrows, title, lender fees)
- Initial repairs, turnover maintenance, or cosmetic updates
- Furnishings (if renting mid-term or furnished)
- Initial reserve deposit dedicated specifically to that property
2. Annual Net Cash Flow
Annual net cash flow is what remains from your gross rental income after paying all property-level operating expenses (property taxes, insurance, routine repairs, property management, HOA dues, utilities) and full mortgage payments (principal and interest).
If you need to establish your baseline cash flow before calculating your payback timeline, use our rental cash flow calculator.
Worked Example: Simple vs. Cumulative Payback Period
In the real world, rental cash flow is rarely identical from year to year. While the simple payback period assumes flat cash flow, the cumulative payback method tracks annual fluctuations (such as rent increases, unexpected repairs, or tenant turnover) until the cumulative sum crosses zero.
Let us look at a realistic rental acquisition to see both methods in action.
Acquisition Scenario
- Purchase price: $240,000
- Down payment (20%): $48,000
- Closing costs & lender fees: $6,000
- Immediate make-ready repairs: $6,000
- Total initial cash invested: $60,000
Method 1: The Simple Payback Calculation
Assume the property rents for $2,100 per month ($25,200 annually). After paying operating expenses, vacancy allowances, and a monthly mortgage payment of $1,250, the property nets $500 per month in cash flow ($6,000 per year).
- Total initial investment: $60,000
- Annual cash flow: $6,000
- Calculation: 60,000 / 6,000 = 10.0 years
Under static conditions, it takes precisely 10 years to recoup the $60,000 cash outlay.
Method 2: The Cumulative Payback Calculation (Dynamic Cash Flow)
In practice, rents increase over time, but intermittent capital expenditures (CapEx vs OpEx) and tenant turnovers disrupt steady earnings. Tracking year-by-year cumulative cash flow provides the true payback date:
| Year | Gross Rent | Operating & Debt Costs | CapEx / Turnover Spikes | Annual Net Cash Flow | Cumulative Cash Recovered | Remaining Balance to Breakeven |
|---|---|---|---|---|---|---|
| 0 | — | — | — | — | $0 | -$60,000 |
| 1 | $25,200 | $19,200 | $1,000 (initial minor fixes) | $5,000 | $5,000 | -$55,000 |
| 2 | $25,950 | $19,350 | $0 | $6,600 | $11,600 | -$48,400 |
| 3 | $26,730 | $19,530 | $3,500 (HVAC replacement) | $3,700 | $15,300 | -$44,700 |
| 4 | $27,530 | $19,730 | $0 | $7,800 | $23,100 | -$36,900 |
| 5 | $28,350 | $19,950 | $1,200 (turnover painting/floors) | $7,200 | $30,300 | -$29,700 |
| 6 | $29,200 | $20,180 | $0 | $9,020 | $39,320 | -$20,680 |
| 7 | $30,080 | $20,420 | $0 | $9,660 | $48,980 | -$11,020 |
| 8 | $30,980 | $20,670 | $0 | $10,310 | $59,290 | -$710 |
| 9 | $31,900 | $20,930 | $0 | $10,970 | $70,260 | +$10,260 (Fully Paid Back) |
In this realistic cumulative timeline, the landlord crosses the breakeven mark during the first month of Year 9 (roughly 8.1 years).
Even though major maintenance in Year 3 temporarily lowered net profits, gradual rent increases compounded cash flow in later years, recovering the initial $60,000 investment nearly two full years faster than the flat estimate.
How Financing and Leverage Warp the Payback Window
Many property owners assume that putting less money down automatically shortens the payback period because the initial capital requirement is smaller. In reality, financing creates a direct trade-off between the upfront denominator and the ongoing annual numerator.
Consider the same $240,000 property under three financing scenarios:
Scenario A: All-Cash Purchase
- Total cash invested: $246,000 (Purchase price + $6,000 closing/rehab)
- Annual gross rent: $25,200
- Annual operating expenses (no mortgage): $5,200
- Annual net cash flow: $20,000
- Payback period: 246,000 / 20,000 = 12.3 years
Scenario B: 20% Down Conventional Mortgage
- Total cash invested: $60,000
- Annual gross rent: $25,200
- Operating expenses + mortgage debt service: $19,200
- Annual net cash flow: $6,000
- Payback period: 60,000 / 6,000 = 10.0 years
Scenario C: 5% Down Low-Equity Loan
- Total cash invested: $24,000 ($12,000 down + $6,000 closing + $6,000 rehab)
- Annual gross rent: $25,200
- Operating expenses + high mortgage debt service + PMI: $23,800
- Annual net cash flow: $1,400
- Payback period: 24,000 / 1,400 = 17.1 years
Notice that while Scenario C requires the smallest out-of-pocket check, the heavy monthly debt payment compresses net cash flow so severely that the payback period balloons to over 17 years. The shortest payback period occurs where moderate leverage leaves enough monthly margin for the property to generate healthy cash flow.
Payback Period vs. Cash-on-Cash Return: The Mathematical Link
Landlords often ask how the payback period differs from cash-on-cash return. The two metrics are mathematical inverses of each other:
Cash-on-cash return = (annual net cash flow / total cash invested) x 100
Simple payback period = total cash invested / annual net cash flow
`` Payback Period (Years) = 100 / Cash-on-Cash Return Percentage ``
If a rental property generates an 8% cash-on-cash return:
- Payback period = 100 / 8 = 12.5 years
If you optimize operations to achieve a 12% cash-on-cash return:
- Payback period = 100 / 12 = 8.33 years
Why Payback Period Adds Distinct Value
Cash-on-cash return evaluates a single snapshot year (usually Year 1). The payback period forces you to view your portfolio from a capital-at-risk perspective. A deal with an 8% cash-on-cash return sounds appealing in isolation, but framing it as "twelve and a half years to get my initial cash back" highlights the long-term operational consistency required to make that return a reality.
Limitations of the Payback Period Metric
While the payback period is an essential metric for capital preservation, it has inherent blind spots when used as the sole deciding factor in rental property analysis:
- Ignores Cash Flow After Breakeven: A property with a 5-year payback period that stagnates afterward might be a worse long-term asset than a property with an 8-year payback period that produces massive cash flow for decades.
- Omits Principal Paydown: Your mortgage payment steadily builds equity by paying down principal. Payback period tracks purely liquid cash flow, ignoring the net worth accumulated inside the property's loan balance.
- Omits Long-Term Appreciation: Payback period does not factor in future property value increases or eventual sale proceeds upon disposition.
- Ignores the Time Value of Money: In its basic form, the payback period treats a dollar received in Year 8 as equal to a dollar invested today. (Using discounted cash flow adjustments addresses this, but simple tracking remains standard for small portfolio management).
Practical Ways to Accelerate Your Capital Recovery
To shorten your payback period on an existing rental or prospective deal, you must either decrease the initial capital required or widen your ongoing rental property profit margin.
- Implement Systematic Rent Increases: Leaving rents stagnant adds years to your payback horizon. Review market rates annually and adjust rents predictably (how to calculate a rent increase).
- Eliminate Expense Leakage: Audit recurring costs like landscaping, insurance policies, and third-party maintenance charges. Lowering monthly operating expenses by $100 adds $1,200 directly to annual net cash flow.
- Prioritize High-ROI Improvements: Focus upfront capital expenditures only on improvements that translate directly into higher monthly rent or lower maintenance calls (e.g., durable hard flooring rather than expensive custom trim).
Keep a Clear View of Your Capital Recovery
Calculating your payback period on a napkin at purchase is a starting point, but tracking whether your property actually meets those projections requires ongoing monthly clarity. Unbudgeted repairs, utility creep, and intermittent vacancies can quietly push a projected 7-year payback out past a decade.
Propertira helps you track monthly income and expenses across every rental property in your portfolio. You can see your actual net cash flow over time, monitor where your rental income goes, and know exactly how close you are to recovering your initial investment.
- payback period
- cash flow
- profitability
- investing metrics
- roi
Related guides
- Break-Even Occupancy Rate: How to Calculate It for Rental PropertiesCalculate the exact percentage of the year your rental property must stay occupied to cover all operating expenses and mortgage payments without losing cash.
- Keep or Sell? How to Run the Numbers on an Underperforming RentalDeciding whether to keep or sell an underperforming rental comes down to Return on Equity and opportunity cost. Here is how to run the numbers step by step.
- Internal Rate of Return (IRR) for Rental Property: How to Calculate and Use ItInternal Rate of Return (IRR) accounts for ongoing net cash flow, mortgage paydown, and exit valuation to give landlords a true annualized return over a holding period. Here is how it works and how to calculate it.
Put this into practice
Use the free calculators with your own figures, or track every property in one place with Propertira.
Propertira provides estimates based on the information you enter. Results are for informational purposes only and are not financial, tax, legal or investment advice.